

Editor’s Note: Here’s Ong Yi Shen’s second blog post, which is a continuation of his first post. You can read his first post here.
Continuing with part 1, I will continue to use the cleaned data from the CSV to create a more detailed report, this time I want to create a report for each individual teacher, with aggregated statistics for each teaching group.
There are a few statistics that I want to include in my CSV file, one of them is the count and percentage of the scores of each rubric. In the responses.csv, students have rated teachers on different criteria with a score from 1 to 4. I also want to include the mean of the teacher and teaching group, the mean of the teaching group as well as the mean of the entire school.
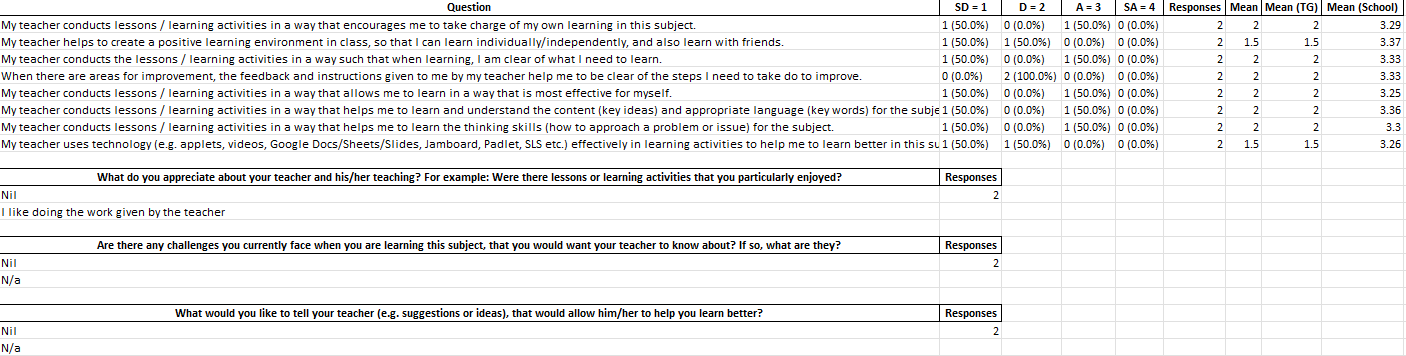
Here is an example of what I want the CSV to look like once it is done
The handy groupby method is used here again, we do a groupby on “Name of Teacher” and “Teaching Group”. We then iterate through each group.
Let’s start with counting the scores of the rubrics of each group. There is a useful method called value_counts which can be used to get the counts of each unique value of a series.
The rubric columns of the responses contain the score that each respondent has given to a teacher or teaching group.
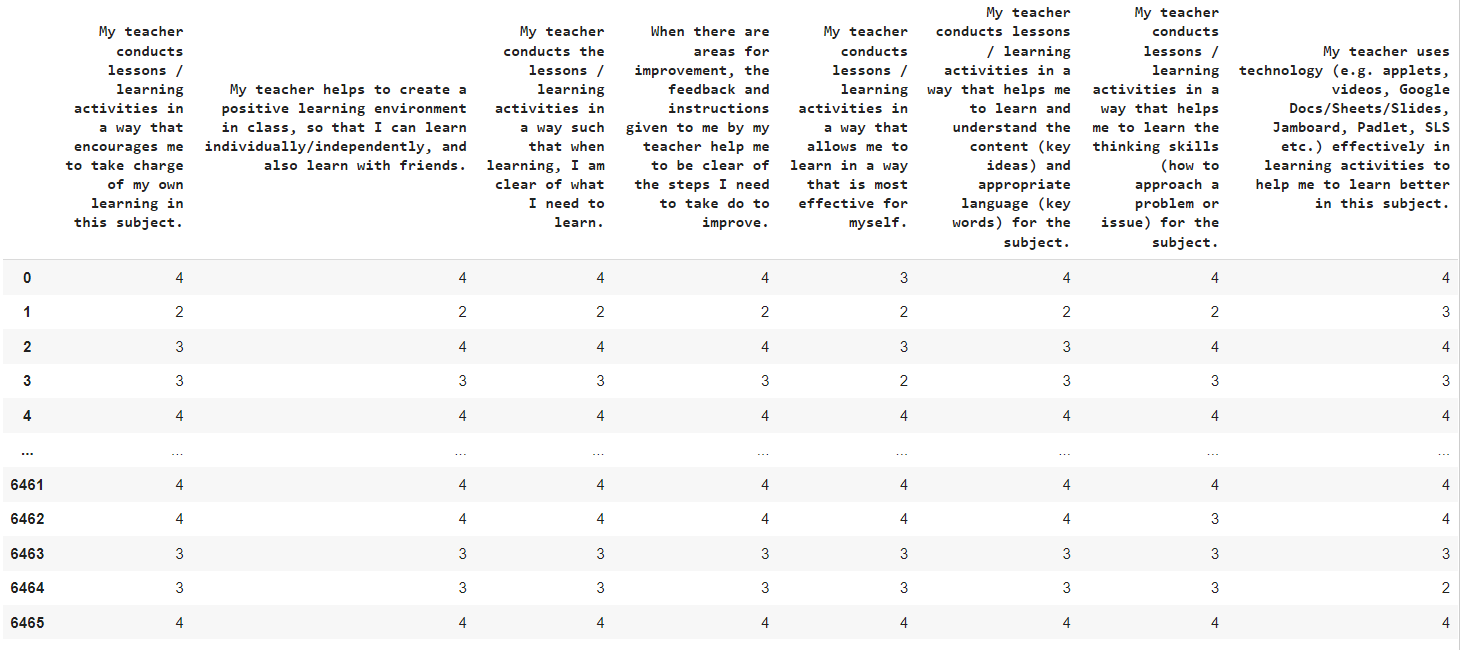
I first filter the group by rubric_columns so that it is just the dataframe containing the rubric columns, I then use .apply() with the function Series.value_counts, this will get the counts of each unique value in the column. I then use transpose to flip the rows and columns.
group[rubric_columns].apply(pd.Series.value_counts).fillna(0).transpose().convert_dtypes()There is an issue with this though, what happens if in the column there isn’t any score of a particular value? For Series.value_counts, it will only count for each unique value that appears. If a column only contains 2 unique values such as 4 and 3, the dataframe will only contain columns of counts for 4 and 3. I want columns 1 and 2 to still be created but have a count of 0.
I created a new function called add_missing_cols, which takes in a dataframe. If the number of columns in the dataframe is less than 4, it will add in the missing columns and fill the values with 0. This will solve the missing column issue.
def add_missing_cols(df):
  if len(df.columns) <= 4:
    missing_cols = set([1, 2, 3, 4]) - set(df.columns)
    for col in missing_cols:
      df[col] = 0
  return df[[1, 2, 3, 4]]
Another thing to consider is I want the percentage for the count to the total counts to appear next to each count, so I created another function to do so.
Percentage takes in a series and using sum(), gets the total counts and then uses it to get the percentage of each count. The result is then concatenated together with the count and a string is returned.
def percentage(x):
  return x.astype(str) + " (" + (x * 100/x.sum()).round(1).astype(str) + "%)"
I then apply this function to the 1, 2, 3 and 4 columns
group[[1, 2, 3, 4]] = group[[1, 2, 3, 4]].apply(lambda x: percentage(x), axis=1)Next up is getting the total number of responses using sum() and storing the results in a new column “Responses”
group.loc[:, "Responses"] = group.apply(lambda x: x.sum(), axis=1)I also get the mean of “Name of Teacher”, “Teaching Group”, “Teaching Group” as well as the mean of the entire school using groupby .
mean = new_df.groupby(["Name of Teacher", "Teaching Group"]).mean(numeric_only = True).transpose().round(2)
tg_mean = new_df.groupby("Teaching Group").mean(numeric_only = True).transpose().round(2)
sch_mean = new_df.mean(numeric_only = True).round(2)
I iterate through the different groups of “Name of Teacher”, “Teaching Group”. For each group, count the unique values of the rubrics column and add in missing columns if needed. Then calculate the percentage and concatenate it to the counts.
Apply and sum are used to get the number of responses.
The 3 different dataframes created earlier are used to get the mean, teaching group mean and school mean. By using loc, I can pass in name_tg, which is a “Name of Teacher”, “Teaching Group” tuple to the mean dataframe to get the mean of that particular teacher and teaching group.
I can pass in name_tg[1] which is the teaching group to the tg_mean dataframe to get the mean of that particular teaching group.
I also renamed the columns at the end of each iteration.
mean = new_df.groupby(["Name of Teacher", "Teaching Group"]).mean(numeric_only = True).transpose().round(2)
tg_mean = new_df.groupby("Teaching Group").mean(numeric_only = True).transpose().round(2)
sch_mean = new_df.mean(numeric_only = True).round(2)

for name_tg, group in new_df.groupby(["Name of Teacher", "Teaching Group"]):
    group = group[rubric_columns].apply(pd.Series.value_counts).fillna(0).transpose().convert_dtypes()
    group = add_missing_cols(group)
    group[[1, 2, 3, 4]] = group[[1, 2, 3, 4]].apply(lambda x: percentage(x), axis=1)

    group.loc[:, "Responses"] = group.apply(lambda x: x.sum(), axis=1)
    group.loc[:, "Mean"] = mean.loc[:, name_tg]
    group.loc[:, "Mean (TG)"] = tg_mean.loc[:, name_tg[1]]
    group.loc[:, "Mean (School)"] = sch_mean

    group = group.reset_index()
    group = group.rename(columns = {"index": "Question", 1: "SD = 1", 2: "D = 2", 3: "A = 3", 4: "SA = 4"})
There are also 3 columns which allow for open-ended answers in the responses CSV. I want to get those responses and add them below the rubrics in the final CSV.
I convert each of them to a frame and fill in any NaN with Nil
written_response_1 = group.loc[:, "What do you appreciate about your teacher and his/her teaching? For example: Were there lessons or learning activities that you particularly enjoyed?"].to_frame().fillna("Nil")
written_response_2 = group.loc[:, "Are there any challenges you currently face when you are learning this subject, that you would want your teacher to know about? If so, what are they?"].to_frame().fillna("Nil")
written_response_3 = group.loc[:, "What would you like to tell your teacher (e.g. suggestions or ideas), that would allow him/her to help you learn better?"].to_frame().fillna("Nil")
This is the final code that generates all the required dataframes. The dataframes are stored in a dictionary which will be used later on when we want to add all of them into the Excel file.
d = collections.defaultdict(dict)

mean = new_df.groupby(["Name of Teacher", "Teaching Group"]).mean(numeric_only = True).transpose().round(2)
tg_mean = new_df.groupby("Teaching Group").mean(numeric_only = True).transpose().round(2)
sch_mean = new_df.mean(numeric_only = True).round(2)

for name_tg, group in new_df.groupby(["Name of Teacher", "Teaching Group"]):

    written_response_1 = group.loc[:, "What do you appreciate about your teacher and his/her teaching? For example: Were there lessons or learning activities that you particularly enjoyed?"].to_frame().fillna("Nil")
    written_response_2 = group.loc[:, "Are there any challenges you currently face when you are learning this subject, that you would want your teacher to know about? If so, what are they?"].to_frame().fillna("Nil")
    written_response_3 = group.loc[:, "What would you like to tell your teacher (e.g. suggestions or ideas), that would allow him/her to help you learn better?"].to_frame().fillna("Nil")

    group = group[rubric_columns].apply(pd.Series.value_counts).fillna(0).transpose().convert_dtypes()
    group = add_missing_cols(group)

    group.loc[:, "Responses"] = group.apply(lambda x: x.sum(), axis=1)
    group.loc[:, "Mean"] = mean.loc[:, name_tg]
    group.loc[:, "Mean (TG)"] = tg_mean.loc[:, name_tg[1]]
    group.loc[:, "Mean (School)"] = sch_mean

    group[[1, 2, 3, 4]] = group[[1, 2, 3, 4]].apply(lambda x: percentage(x), axis=1)

    group = group.reset_index()
    group = group.rename(columns = {"index": "Question", 1: "SD = 1", 2: "D = 2", 3: "A = 3", 4: "SA = 4"})

    d[name_tg[0]][name_tg[1]] = [group, written_response_1, written_response_2, written_response_3]
I created a directory in Colab, which will store all the summaries of each teacher.
!mkdir "Individual Teacher Summary"Each CSV file will be named according to the teacher. However, we have to take into account that sometimes their names contain “/” such as “S/O”. This can mess up paths since “/” is used to identify directories. As such we want to replace “/” with something else.
escapedname = name.replace("/", "")
writer = pd.ExcelWriter(f"Individual Teacher Summary/{escapedname} summary.xlsx", engine="xlsxwriter")
In the Excel file, I want the first sheet to contain the aggregated statistics of the teacher, and the rest of the sheets to contain the statistics of each teaching group that the teacher teaches. I created a dummy worksheet to act as the first worksheet, the reason is that xlsxwriter advises against reordering worksheets, and the data that is supposed to be in aggregate can only be obtained after I aggregated it from the other sheets.
Recall the dictionary created before is a dictionary in a dictionary, with the top-level dictionary containing the dictionaries for each teacher and the bottom-level dictionary containing the different teaching groups for that teacher.
The item of the bottom level dictionary is a list with 4 elements, the first being the dataframe containing the counts and means, the second being the dataframe with the first written responses, the third element is a dataframe containing the second written responses and the last element is a dataframe containing the third written responses.
As such I iterate through the dictionary, which in this case are the teacher names and create an Excel file for each of them. Then I iterate through the teaching groups of each teacher.
To add a dataframe to an Excel file in xlsx writer, one has to specify which is the starting row of the Excel in which the dataframe will be placed. I specified these rows in the start_rows list.
I want the written responses to be placed below the initial dataframe, as such using the length of the index with some extra offset, I specify where to place the first written response.
len(d[name][tg][0].index) + 2The second written response needs to be placed below the first written response, so I add the length of their indexes together with an offset.
len(d[name][tg][0].index) + len(d[name][tg][1].index) + 4,The third written response is also similarly placed underneath the second response.
len(d[name][tg][0].index) + len(d[name][tg][1].index) + len(d[name][tg][2].index) + 6I added the first dataframe to the sheet, I don't specify a start row for this dataframe since it's the first dataframe and I want it to be placed at the very top left.
d[name][tg][0].to_excel(writer, sheet_name=tg, index=False)I iterate through the start_rows list and add the remaining dataframes to the sheet based on the different starting rows. I added an additional column to the right of the written responses that counts the number of written responses as well.
for i, row in enumerate(start_rows):
      d[name][tg][i + 1].to_excel(writer, sheet_name=tg, startrow=row, index=False)
      pd.DataFrame({"Responses": [len(d[name][tg][1].index)]}).to_excel(writer, sheet_name=tg, startrow=row, startcol=1, index=False)
Near the end of the iteration, I want to store the total responses and total open-ended responses so I can aggregate them for the first worksheet.
I used the autofit method to automatically fit the widths of the columns to the text as well.
total_response += d[name][tg][0].loc[0, "Responses"]
total_response_open += len(d[name][tg][1].index)

worksheet = writer.sheets[tg]
worksheet.autofit()
Here is the full code, after all the teaching groups have been iterated through, the responses are aggregated, turned into a dataframe and placed in the first worksheet. This repeats for all teachers.
for name in d:
  escapedname = name.replace("/", "")
  writer = pd.ExcelWriter(f"Individual Teacher Summary/{escapedname} summary.xlsx", engine="xlsxwriter")

  dummy = pd.DataFrame()
  dummy.to_excel(writer, sheet_name="Aggregate")

  total_response = 0
  total_response_open = 0

  for tg in d[name]:

    start_rows = [
        len(d[name][tg][0].index) + 2,
        len(d[name][tg][0].index) + len(d[name][tg][1].index) + 4,
        len(d[name][tg][0].index) + len(d[name][tg][1].index) + len(d[name][tg][2].index) + 6,
    ]

    d[name][tg][0].to_excel(writer, sheet_name=tg, index=False)

    for i, row in enumerate(start_rows):
      d[name][tg][i + 1].to_excel(writer, sheet_name=tg, startrow=row, index=False)
      pd.DataFrame({"Responses": [len(d[name][tg][1].index)]}).to_excel(writer, sheet_name=tg, startrow=row, startcol=1, index=False)

    total_response += d[name][tg][0].loc[0, "Responses"]
    total_response_open += len(d[name][tg][1].index)

    worksheet = writer.sheets[tg]
    worksheet.autofit()

  agg = {
      "Teacher": [name],
      "Number of Teaching Groups": [len(d[name])],
      "Total responses across all TGs": [total_response],
      "Total responses across all TGs (open ended)": [total_response_open]
  }
  agg = pd.DataFrame(agg).transpose()
  agg.to_excel(writer, sheet_name="Aggregate", header=False)

  worksheet = writer.sheets["Aggregate"]
  worksheet.autofit()

  writer.close()
The final step is to simply zip up the directory and it is ready to be downloaded!
!zip -r "Individual Teacher Summary.zip" "Individual Teacher Summary"