

Editor’s Note: We were recently engaged by a school to conduct a teaching and learning (T&L) survey. In this survey, students offered valuable feedback on their teachers, the classroom learning environment and much much more… With the huge amount of data we collected, we turned to Python programming to help us process the survey results.
Below, Ong Yi Shen, our intern from Nanyang Technological University (NTU) tackles this task as he uses a variety of Python tricks to clean, analyse and report data obtained from CSV files.
The code will be running on Google Colab, which allows for running Python code in the browser using cloud computing. One can even connect to a runtime with a GPU to allow for machine learning. By default, the runtime will only have a CPU which is enough for our use case.
Pandas is a Python library that allows for data manipulation and analysis. Pandas is already installed in the runtime by default. If Python is running on your PC instead, the following commands would need to be executed in the command prompt or any sort of shell environment depending on your operating system to install Pandas if not done so already:
pip install pandasFirst, we start off by importing pandas:
import pandas as pdThe “as” keyword is basically an alias, so instead of using pandas.read_csv (which can be quite lengthy), we can shorten it to pd.read_csv instead.
On the left side of Google Colab, you can drag and drop the files needed. (Recall that Google Colab is using cloud computing, so files that will be used to generate the report need to be uploaded)
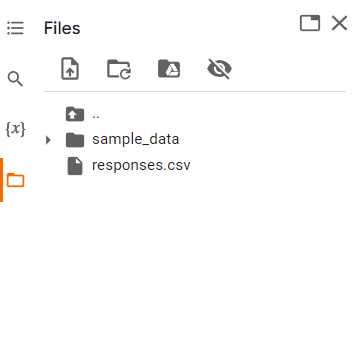
Using pandas, I read the “responses.csv” file which returns a Pandas dataframe object which I saved into the variable df.
df = pd.read_csv("responses.csv")I can view the dataframe by calling the head() method which shows the first few rows of the dataframe. By default, it is 10 rows but I specified an argument in the code snippet below. Passing an argument to the head() method will allow you to choose how many rows to display.
df.head(5)These are just some of the column names shown with the .head() method:

Strangely, there are duplicate columns of “Teaching Group”.
import re
indexes = []
for i, col in enumerate(df.columns):
  if re.match("Teaching Group", col):
    indexes.append(i)
print(indexes)
I notice that the duplicate Teaching Group columns all start with “Teaching Group”, as such I use regex to find out how many columns are duplicated like this. I do a for loop over df.columns, I place df.columns in an enumerate function as well so that it will return both the index and the column name when I loop through it. Then for each name I use re.match() which uses regex to try to find if the name contains “Teaching Group”. If there is “Teaching Group” in its name the index of that column will be added to a list. After the loop is finished, I print the list out.
The result is a list ranging from index 3 all the way to index 96.
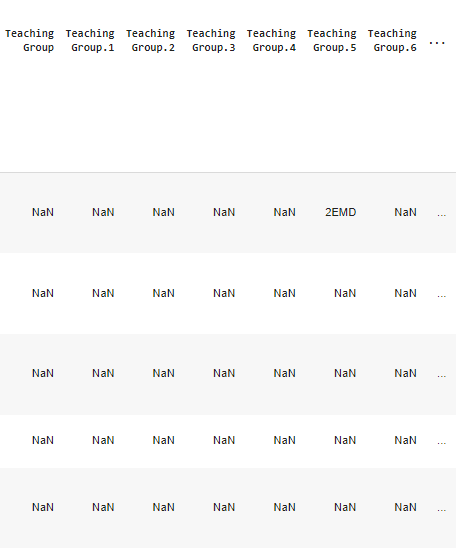
Something interesting I noticed as well is that each row is filled with NaN values. I also noticed that for each row, among the NaN values in the Teaching Group columns, one of these columns will contain the teaching group.
Let's test this theory out!
Since I already have the list of indexes of the duplicate teaching groups, I can use iloc to select only those rows and count the number of non-NaN values in each row
teaching_groups_df = df.iloc[:, indexes]
teaching_groups_df.apply(lambda x: len(indexes) - x.isna().sum(), axis=1)
I created a new dataframe called teaching_groups_df that only contains columns from the duplicate teaching groups.
I then use the apply() method on the dataframe. Apply() will apply a function along the chosen axis of the dataframe, which with the argument axis = 1, will cause it to apply a function to every row in the dataframe.
Pandas will pass in a series object, which in this case will be rows of teaching_groups_df into our chosen function.
I use a lambda function to do the counting of non-NaN values. X is the series object being passed into the function, as such I call the isna() object on x which will return a series of true and false values indicating which values satisfy the is NaN constraint. I then call the .sum() method which will sum up all the True values in this series, giving me the total number of NaN values in the row. I can then subtract this number from the total number of columns to get what I want, which is the number of non-NaN values in each row.
This is the result! However, at first glance, we can’t really tell if every single row has only 1 non-NaN value, there are too many rows
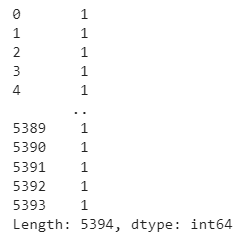
We can use the set() function on the series to get all the unique values, if our guess is correct, the only numbers in this set should be 1.
set(teaching_groups_df.apply(lambda x: len(indexes) - x.isna().sum(), axis=1))After applying the set() function I get a set containing only one number, 1.

Now after confirming this is the case, I can go ahead with merging all the duplicate columns into one “Teaching Group” column containing the teaching group.
Similar to what I did above, I can use apply() to apply a function to the rows of the dataframe.
def remove_na(x):
  return x[x.notnull()].squeeze()
Remove_na() will take in a series object x, then x will call the method notnull() to get a series of boolean values indicating which values are not NaN. I then use this series as a filter to filter out all the columns that are NaN. Finally, since I know there will only be 1 value that is not NaN, I use the squeeze() method to turn the value into a scalar.
I apply remove_na over the rows and save the results into the “Teaching Group” column of df. I then drop the rest of the duplicate teaching group columns.
df["Teaching Group"] = teaching_groups_df.apply(remove_na, axis=1)
df = df.drop(df.columns[indexes[1:]], axis=1)
I do some extra checks on the dataset as well:
The rubric columns shouldn't be empty, as well as the teacher names, so I do a simple check to see if there are any NaN values in those columns.
rubric_columns = [
    "My teacher conducts lessons / learning activities in a way that encourages me to take charge of my own learning in this subject.",
    "My teacher helps to create a positive learning environment in class, so that I can learn individually/independently, and also learn with friends.",
    "My teacher conducts the lessons / learning activities in a way such that when learning, I am clear of what I need to learn.",
    "When there are areas for improvement, the feedback and instructions given to me by my teacher help me to be clear of the steps I need to take do to improve.",
    "My teacher conducts lessons / learning activities in a way that allows me to learn in a way that is most effective for myself.",
    "My teacher conducts lessons / learning activities in a way that helps me to learn and understand the content (key ideas) and appropriate language (key words) for the subject.",
    "My teacher conducts lessons / learning activities in a way that helps me to learn the thinking skills (how to approach a problem or issue) for the subject.",
    "My teacher uses technology (e.g. applets, videos, Google Docs/Sheets/Slides, Jamboard, Padlet, SLS etc.) effectively in learning activities to help me to learn better in this subject.",
]

print("NaN in Name of Teacher field:", df["Name of Teacher"].isnull().values.any())
print("NaN in rubrics section:", df.loc[:, rubric_columns].isnull().values.any())
Another possibility is that students can submit multiple responses to the survey, and as such I should only take the most recent response.
There is a timestamp field in the CSV, but I want it to be a datetime object instead of a string so I can do time comparisons with it. The timestamps in the CSV file look something like this “2023/04/18 4:46:39 pm GMT+8”. I have to convert it into a datetime object.
I define a function that takes in a string. The timezone is not needed, as such I use .split() to remove the last substring. I then use strptime to parse a string to a datetime object.
I then apply the function on the “Timestamp” column to convert the strings into datetime objects.
from datetime import datetime

def parse_time(x):
  x_split = x.split(" ")
  str_time = " ".join(x_split[0 : -1])
  return datetime.strptime(str_time, "%Y/%m/%d %I:%M:%S %p")

df["Timestamp"] = df["Timestamp"].apply(lambda x: parse_time(x))
I use set_index() to set the index of df to “Name of Teacher”, “Teaching Group” and “Username”. I then sorted the values of the “Timestamp” column in ascending order. The “Username” column contains the username of students. If a student from the same teaching group and teacher submitted multiple responses, I should only take the latest response.
new_df = df.set_index(["Name of Teacher", "Teaching Group", "Username"]).sort_values(by="Timestamp", ascending = True)Since I made the index of new_df to be “Name of Teacher”, “Teaching Group” and “Username”, I can use the .index() method to get the indexes and then the .duplicated() to get a boolean array indicating which values are duplicated in the indexes. I then use this array as a filter for new_df.index to get only those indexes that have duplicates.
new_df.index[new_df.index.duplicated()]I now iterate through the set of duplicate indexes, duplicate being a tuple of the keys of duplicate indexes. I use set() since I only want each duplicate value to show up once.
I filter new_df with this tuple and convert it to a list. I then remove the last item from this list. Since new_df is sorted by “Timestamp” the last item of this series will be the latest response, I only need to know the tuples of the older responses so that I can delete them. I store the list of timestamps (excluding the latest timestamp) in timestamps_list_deleted.
I then iterate through timestamps_list_deleted and append “Timestamp” into a tuple along with ”Name of Teacher”, “Teaching Group”, and “Username”. This tuple is then appended into key_list.
Key_list will now contain the tuples of older responses which I need to delete.
I call set_index() on df again, this time I set the index to be “Name of Teacher”, “Teaching Group”, “Username”, and “Timestamp” and then by iterating through key_list, I drop these indexes.
key_list = []

for duplicate in set(list(new_df.index[new_df.index.duplicated()])):
  timestamp_list = new_df[new_df.index == duplicate]["Timestamp"].to_list()
  timestamps_list_deleted = timestamp_list[:-1]

  for timestamp in timestamps_list_deleted:
    duplicate_list = list(duplicate)
    duplicate_list.append(timestamp)
    key_list.append(tuple(duplicate_list))

new_df = df.set_index(["Name of Teacher", "Teaching Group", "Username", "Timestamp"])

for key in key_list:
  new_df = new_df.drop(index=key)

new_df = new_df.reset_index()
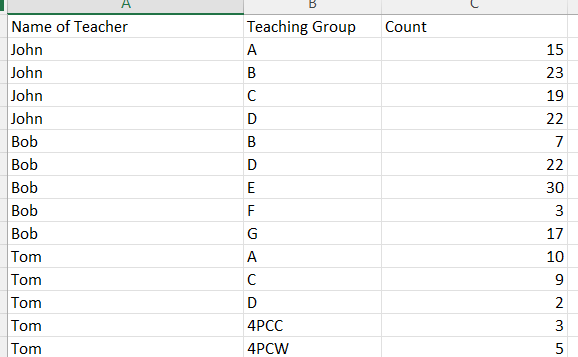
Now that the data is clean, I use group by to group the dataframe into groups of “Name of Teacher” and “Teaching Group”. Then I use the .count() method to count the number of responses for each group. I converted the group by into a dataframe and renamed the column to “Count” and then converted it to a CSV named “count.csv”
df.groupby(["Name of Teacher", "Teaching Group"]).count()["Timestamp"].to_frame().rename(columns={"Timestamp": 'Count'}).to_csv("count.csv")The result is a CSV grouped by “Name of Teacher” and “Teaching Group” along with the counts of each group
Click here to continue part 2 of this article!